OLDaily Over the Years
Still messing around with statistics. Here's the graph of the production of posts on OLDaily over the years since the first posts in 1995:
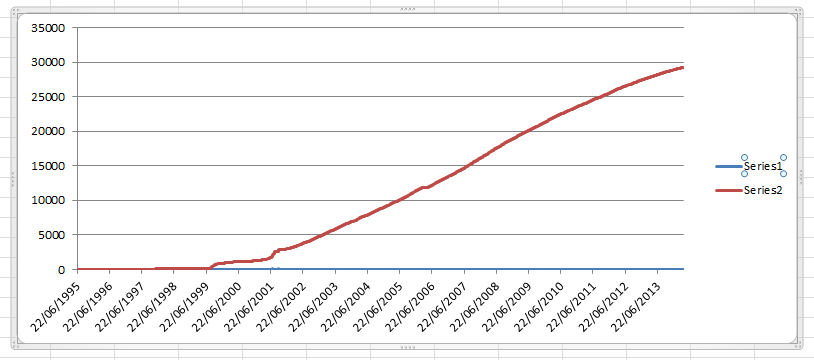
Until 1999 the only posts produced are my articles. Subsequently, as I began the newsletter, the posts include the now-familiar links to resources in OLDaily. The red line represents the total, the blue line represents the daily tally. Notice the flat line where I took a hiatus in 2006. You can also see a bump in 2001. This was from a short period where I experimented with post-creation using the harvester.
Here's the same blue line with a somewhat larger y-axis:

Here again you can see my harvester experiments in 2001 (reaching a peak of 162 posts created on September 22, 2001). But even then, most of my posts were created manually, and sometimes I created a large number of them. I actually remember the very full days back in 2001, and in particular one huge newsletter I created from a cybercafé in Cronulla, Australia. Most of the links from that newsletter no longer exist.
Here's the graph of the persons who have signed up on OLDaily over the years. As you can see, my email subscriptions started in 2001 (that's why when I'm asked when I started, I give one of two dates, either 1995, or 2001).
 This chart needs a little explanation. There are 1480 people without a start date. This reflects a period between 2006 and 2008 when the person-record creation date was not being logged. That's why you have the flat line during that period. So the chart should start in the lower left at '0', and should reflect a gain of 1480 new subscriptions during that flat period.
It's interesting to note that while the growth in sign-ups has never been exponential, it has never really slowed down, either.
Subscriptions are a different story. People come, people go, and a lot of people cancel their subscription and move to RSS. Here's what my subscriptions look like over the years:
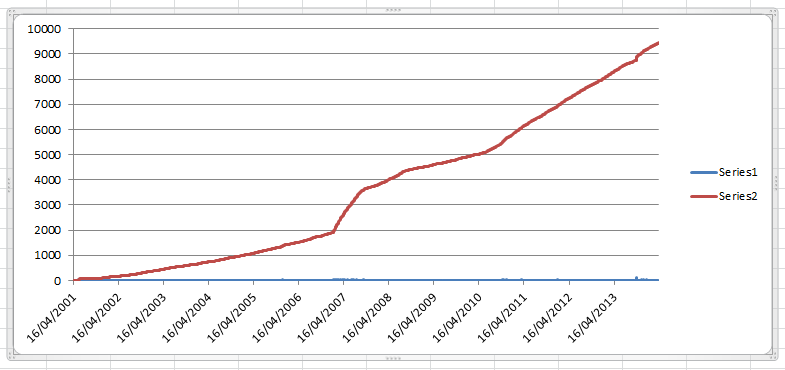
This one's a bit harder to figure out. There's no good reason for the jump in subscriptions in 2007 (except that maybe I came back from my hiatus in 2006 writing slightly longer and opinionated posts - though the same data suggest that people soon tired of the new format).
I don't have good page view history through the years, mostly because my log files have always rotated and I haven't been diligent about keeping statistics. But here are stats for 2012 showing 2.2 million page reads and 774K visits, and here are stats for 2013 showing 5 million page reads and 1.13 million visits.
Meanwhile, in case you're curious, the states for this blog, Half an Hour, as volunteered by Google are as follows:

I'm not sure whether we learn anything from these results, other than that persistence pays, but it's interesting to observe them just the same.
Until 1999 the only posts produced are my articles. Subsequently, as I began the newsletter, the posts include the now-familiar links to resources in OLDaily. The red line represents the total, the blue line represents the daily tally. Notice the flat line where I took a hiatus in 2006. You can also see a bump in 2001. This was from a short period where I experimented with post-creation using the harvester.
Here's the same blue line with a somewhat larger y-axis:
Here again you can see my harvester experiments in 2001 (reaching a peak of 162 posts created on September 22, 2001). But even then, most of my posts were created manually, and sometimes I created a large number of them. I actually remember the very full days back in 2001, and in particular one huge newsletter I created from a cybercafé in Cronulla, Australia. Most of the links from that newsletter no longer exist.
Here's the graph of the persons who have signed up on OLDaily over the years. As you can see, my email subscriptions started in 2001 (that's why when I'm asked when I started, I give one of two dates, either 1995, or 2001).
It's interesting to note that while the growth in sign-ups has never been exponential, it has never really slowed down, either.
Subscriptions are a different story. People come, people go, and a lot of people cancel their subscription and move to RSS. Here's what my subscriptions look like over the years:
This one's a bit harder to figure out. There's no good reason for the jump in subscriptions in 2007 (except that maybe I came back from my hiatus in 2006 writing slightly longer and opinionated posts - though the same data suggest that people soon tired of the new format).
I don't have good page view history through the years, mostly because my log files have always rotated and I haven't been diligent about keeping statistics. But here are stats for 2012 showing 2.2 million page reads and 774K visits, and here are stats for 2013 showing 5 million page reads and 1.13 million visits.
Meanwhile, in case you're curious, the states for this blog, Half an Hour, as volunteered by Google are as follows:
I'm not sure whether we learn anything from these results, other than that persistence pays, but it's interesting to observe them just the same.
Your level of commitment and focus is inspiring, Stephen. I w/d be interested in learning how your approach has changed over time. Do you set information consumption constraints? Are you driven by weekly goals?
ReplyDeleteCheers.
I remember the 2006 hiatus Stephen and how 'shocked' I was. My thought was 'Now how will I keep up to date with what is going on'. So thanks for your ongoing persistence and efforts.
ReplyDeleteSebastian. The full email archives are of course available here and so of course you can see how the content has change over time. But in that time the publication statement has barely changed - you can see the stroked-out version removed in 2001 when I go my current position and no longer needed financial support.
ReplyDeleteIn 2006 I returned with a desire to be a bit more analytical in my posts, adding more content and not just information. But really, the length and content-selection parameters have barely changed over that time. Topics, obviously, have shifted - I did a lot of work on LMSs, learning objects and standards in the early 2000s, more on social networks in the mid- to late-2000s, and of course MOOCs and open online learning over the last few years.
But I think a reader would see a clear and consistent track throughout, framed in approach by the publication statement, and in content by The Future of Online Learning and The Rise and Fall of Wired.